Overview of the Main Dashboard
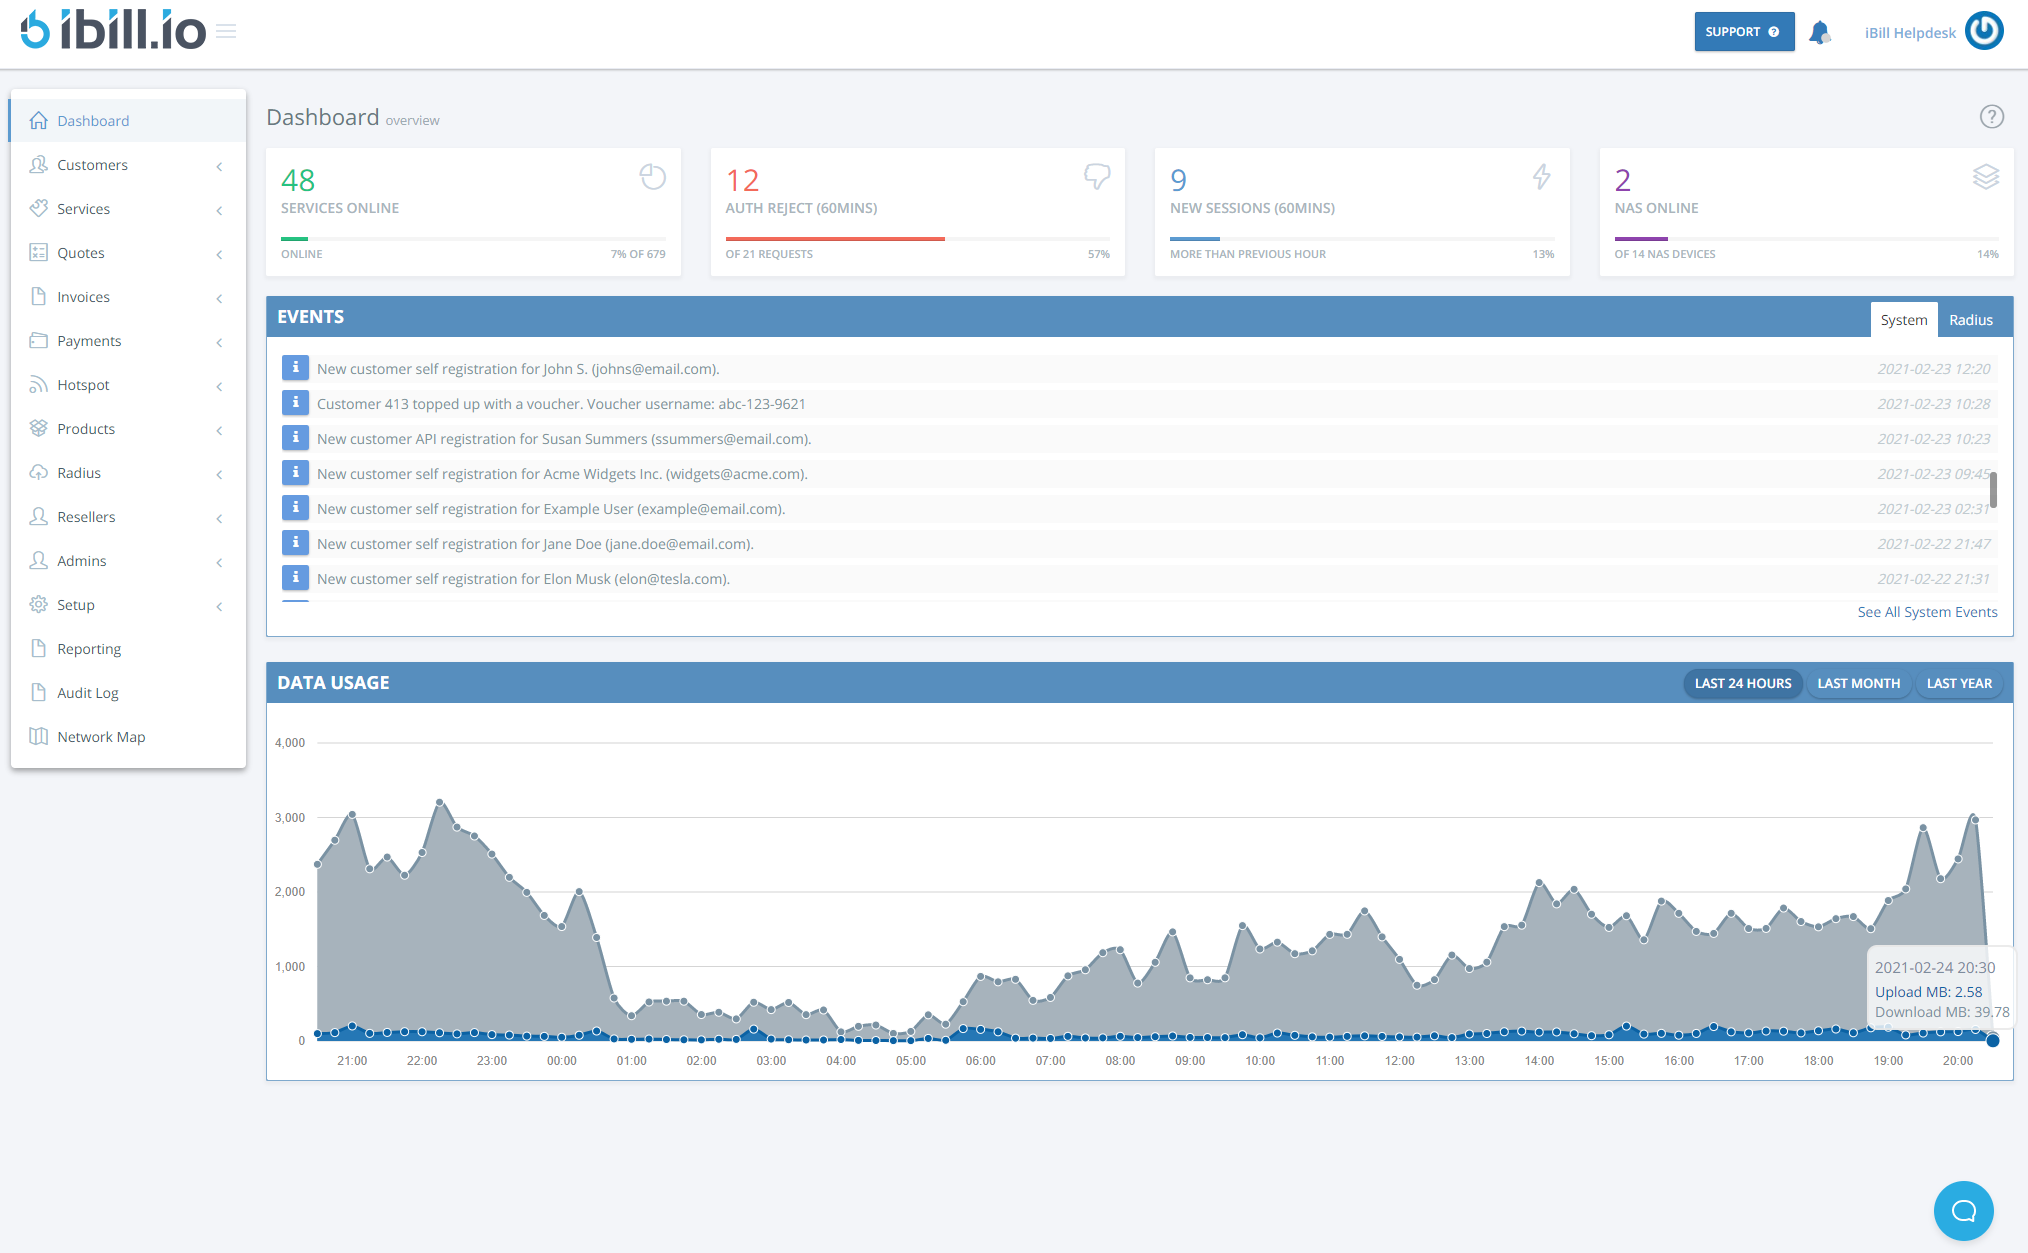
The main dashboard in iBill.io provides instant access to key metrics, recent activity, and system events, helping you monitor your ISP operations at a glance.
Dashboard Overview
-
Services Online: Total number of connected users and the percentage of your user base currently online.
-
klkAuth Reject: Number and percentage of authentication failures in the last 60 minutes.
-
New Sessions: Count of new sessions started in the last hour, compared to the previous hour.
-
NAS Online: Number and percentage of NAS devices currently online (configured under Radius > Manage NAS devices).
Recent Activity
Displays the most recent invoices, including customer details, creation and due dates, payment status, and provisioning state. Quick links allow you to jump directly to invoice or user edit pages.
Upcoming Suspensions
Lists accounts scheduled for suspension due to overdue invoices, including customer name, service ID, invoice details, days overdue, and projected suspension date. This helps you proactively manage customer retention.
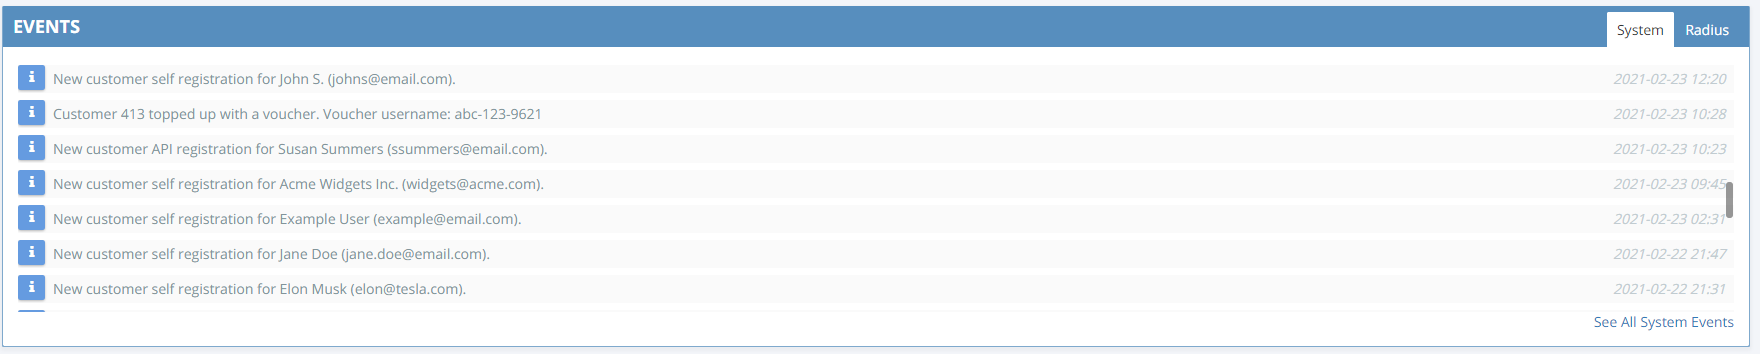
Events
-
System Events: User account changes, configuration updates, and admin actions.
-
RADIUS Events: Session alerts, failed authentications, disconnects, and more.
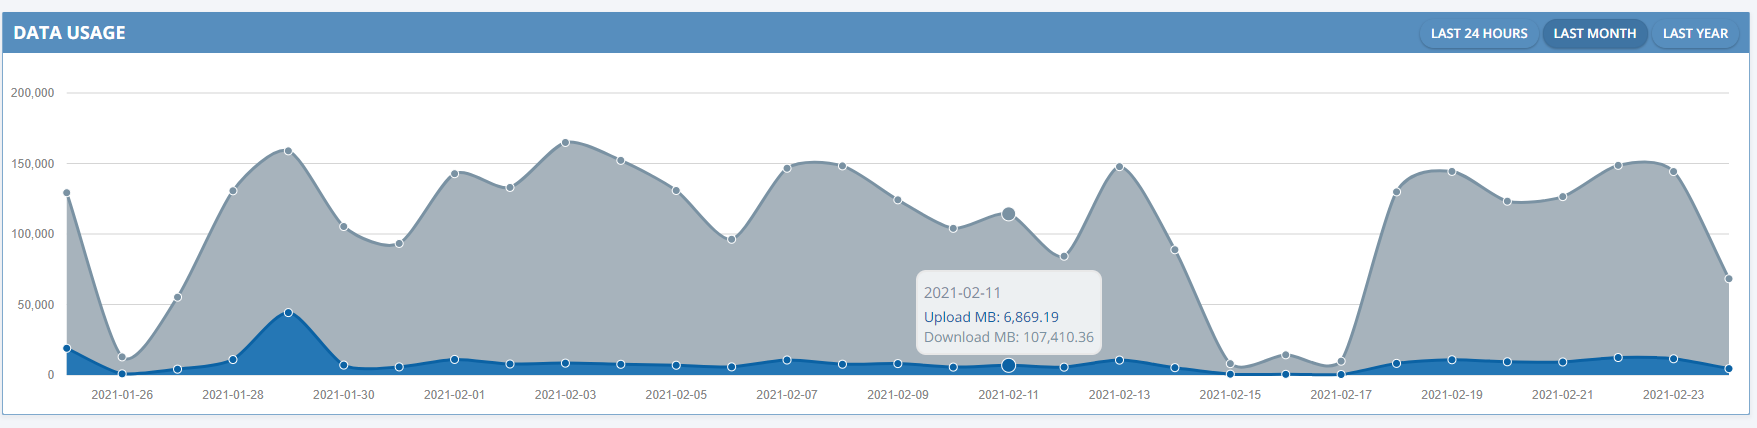
Data Usage
The Data Usage graph shows upload and download data measured via RADIUS accounting, with options to view daily, monthly, or yearly trends.
If you need further assistance, click the support button at the top right of this page.